Skip to content
  • Home
  • Resources
  • Printed PIFA Antenna Validation Data in Simulations
Application Examples

Printed PIFA Antenna Validation Data in Simulations

Request Project Files

This example provides validation data for XFdtd compared to measured data of the return loss for a simple planar inverted-F antenna (PIFA). The example is taken from a journal article published in IEEE Transactions on Antennas and Propagation [1].

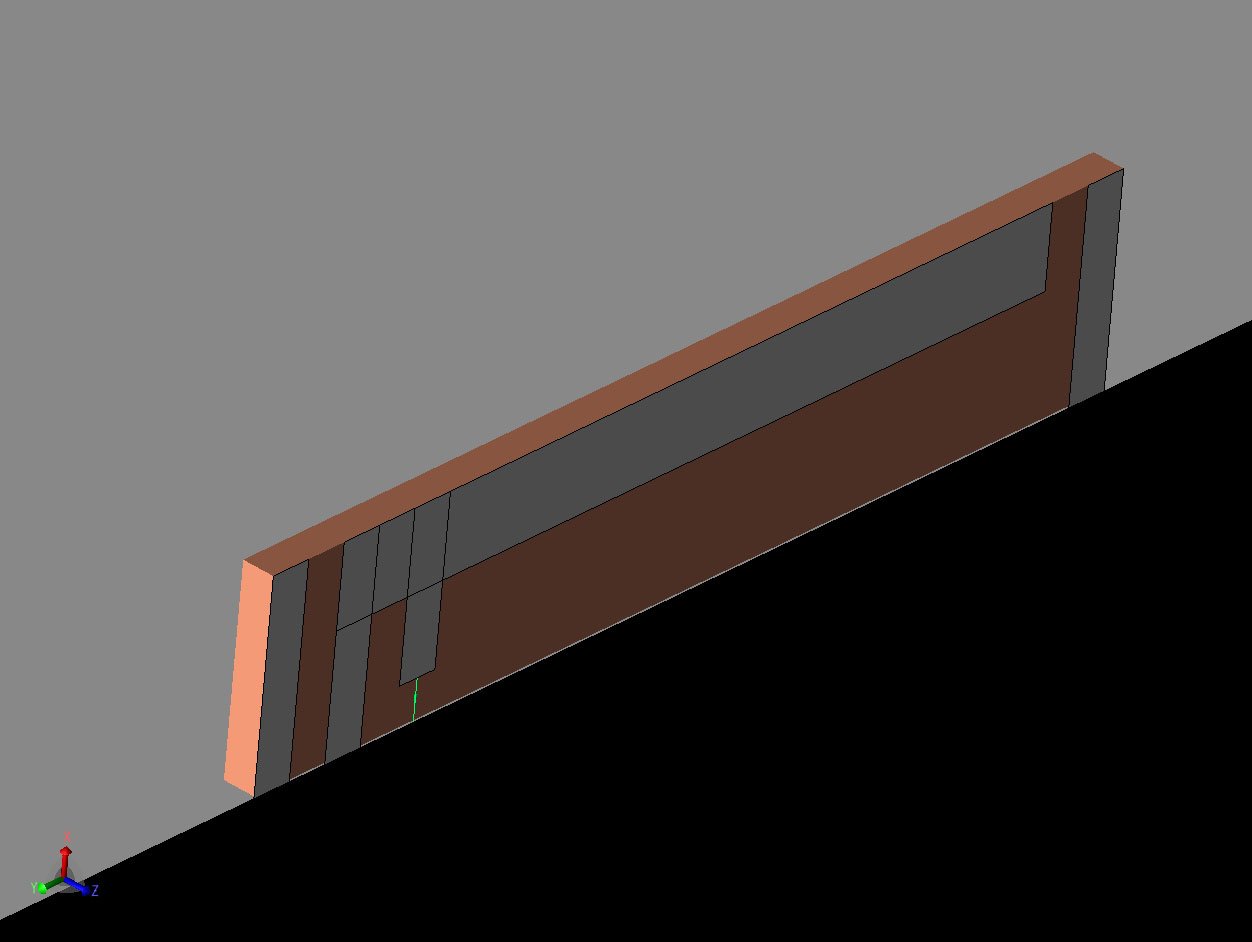
The structure of the antenna is fairly simple with a small, planar antenna printed on a dielectric (FR-4) block mounted above a large, conducting ground plane. The antenna is shown in CAD format in Figure 1 where the white portions represent the conductor and the orange parts are the dielectric material. The antenna is a traditional inverted-F with a shorting leg, a feed leg and a horizontal antenna element. In this example, the antenna is modified to include shielding strips to left and right of the antenna which are added to reduce the influence of nearby components on the antenna performance. The FR-4 material parameters are not defined by the authors of the original paper, but typical values of relative permittivity equal to 4.1 and loss tangent of 0.018 are chosen and seem to match measurements quite closely. The dielectric block supporting the antenna elements is modeled with an averaging layer on the outer surface as is commonly done in simulations containing dielectrics.

Figure 1: CAD view of the antenna geometry in XF7.

Figure 1: CAD view of the antenna geometry in XF.

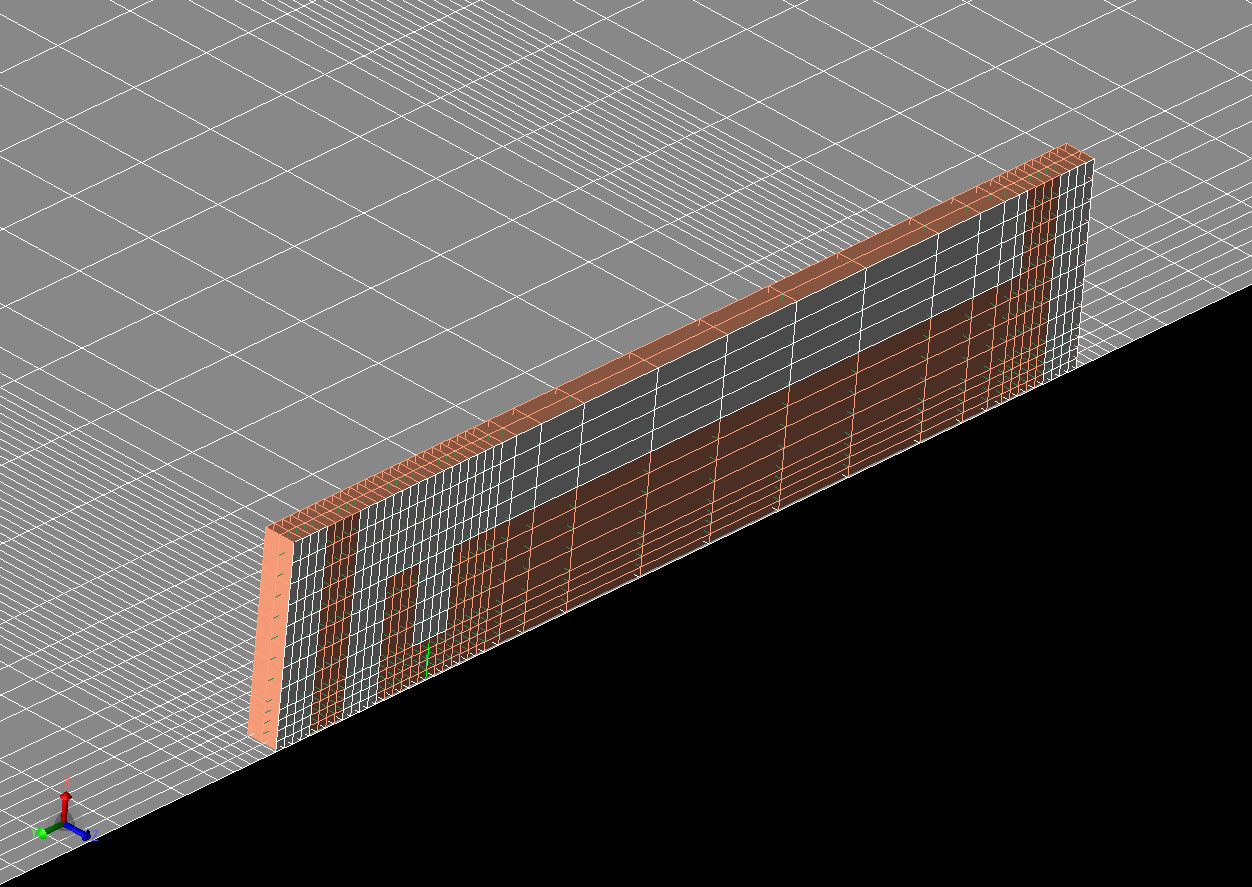
An automatic gridding script is used to create the FDTD mesh of the antenna. This script is available from Remcom and is very useful for new users of the software by removing the task of setting appropriate grid constraints on the geometry. Following the execution of the gridding script, the three-dimensional mesh of the antenna may be seen as shown in Figure 2. The final mesh has FDTD cells ranging in size from 0.25 to 2.2 mm and requires just 96 MB of memory to simulate. A simulation of a broadband voltage source applied at the feed which converges to a -30 dB level takes about two minutes on a standard GPU processing/graphics card (NVIDIA Quadro 3000M) .

Figure 2: Mesh view of the FDTD cells in the antenna after running the automatic gridding script.

Figure 2: Mesh view of the FDTD cells in the antenna after running the automatic gridding script.

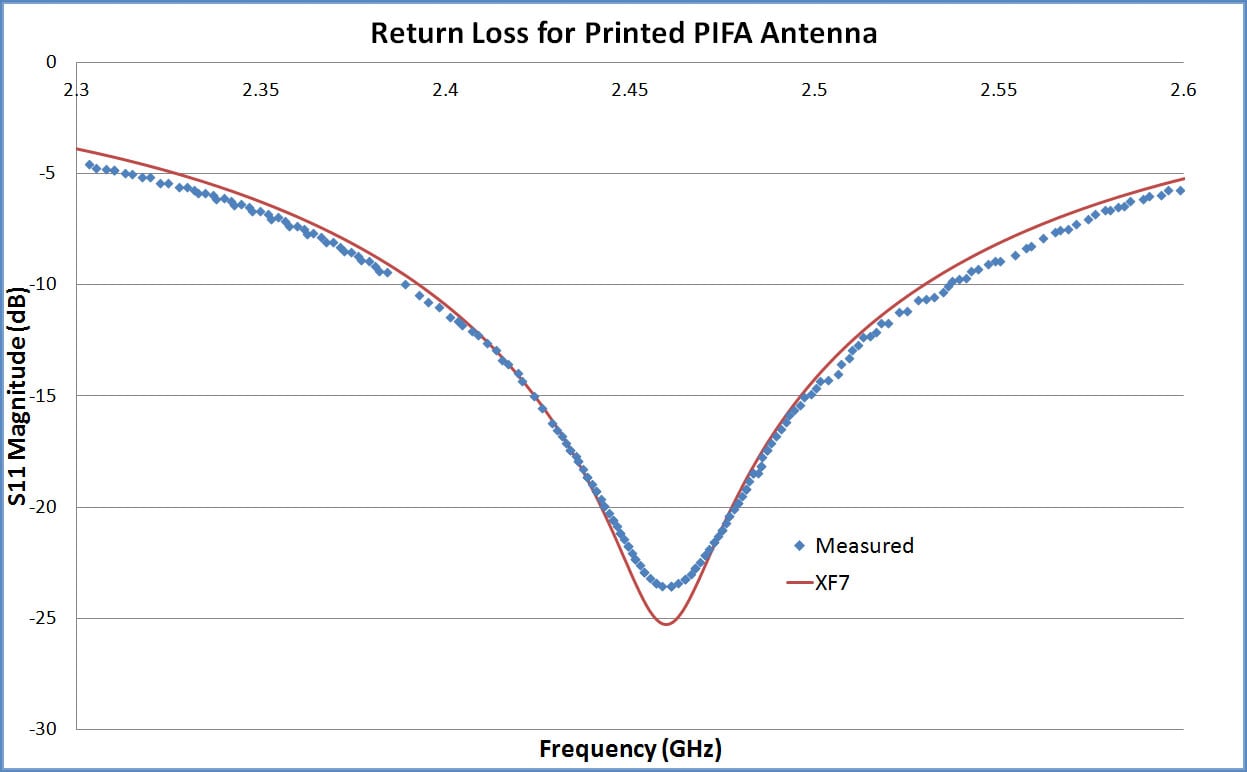
The measured return loss for the antenna is extracted from the referenced paper and plotted versus the results from XFdtd. The comparison in Figure 3 shows very good agreement between the simulated and measured results.

Figure 3: The return loss computed by XF7 which shows good agreement with measured results taken from the referenced paper.

Figure 3: The return loss computed by XFdtd which shows good agreement with measured results taken from the referenced paper.

Reference

  1. K. Wong, C. Chang, and Y. Lin, "Printed PIFA EM Compatible with Nearby Conducting Elements," IEEE Trans. Antennas Propag., Vol. 55, pp. 2919-2922, Oct 2007.

Request Project Files

Thank you for your interest in this application example. Please complete the form below to download the Printed PIFA Antenna Validation Data in Simulations project files.